
What Makes Our Data So Special
Home / What Makes Our Data So Special
Firmographics refer to the demographic characteristics of businesses used for business segmentation. Akin to demographics which focus on individuals, firmographics zoom in on the attributes of organisations. A key firmographic data point is the industry sector the company operates within. In USP Data we have the 1000+ researched report listings in addition to the SIC sector classifications.
Think of it as an enhancement of the most important firmographic selection parameter – so good that we named Unique Sector Performance Data Limited after it. Our product the USP Data app includes the following firmographics:
- Researched Sectors – 1000+ titles
- SIC codes – 730 titles
- Financial Selectors – 42 P&L, Balance Sheet items and KPI Ratios
- Geographic Selectors – Region, Distance From a Postcode, County
- Shareholder Profile – Age, Ownership percentage, Number of Shareholders, Number of Group Companies
- Keywords – built from the business descriptions and websites of the firms.
USP Data has been designed to allow your unique combinations of these selectors to be defined in an effort to quickly zero in on the niche list of firms of relevance.
The Role of Firmographics in Deal Origination
Extensive firmographic data selections in the USP Data app mean that your combination of selection criteria can be defined and saved. Using your saved searches will ensure you are looking at just the relevant companies quickly. Since the latest information on all 5.5+ million live companies in the UK is provided within USP Data it is important to have the right firmographic tools at your fingertips to quickly get to the relevant data on attractive firms that match your requirements.
Using your selections and saving the resulting niche listings into the built in CRM allows you to manage multiple project searches concurrently and share results with your colleagues. Business segmentation has never been so easy.
Leveraging Firmographic Insights for Easy Business Segmentation
Firmographic data is clearly a powerful asset in making informed decisions and for easy business segmentation. By designing suitable search criteria and applying them to the latest information shortlists that are covering relevant niches will quickly emerge using USP Data.
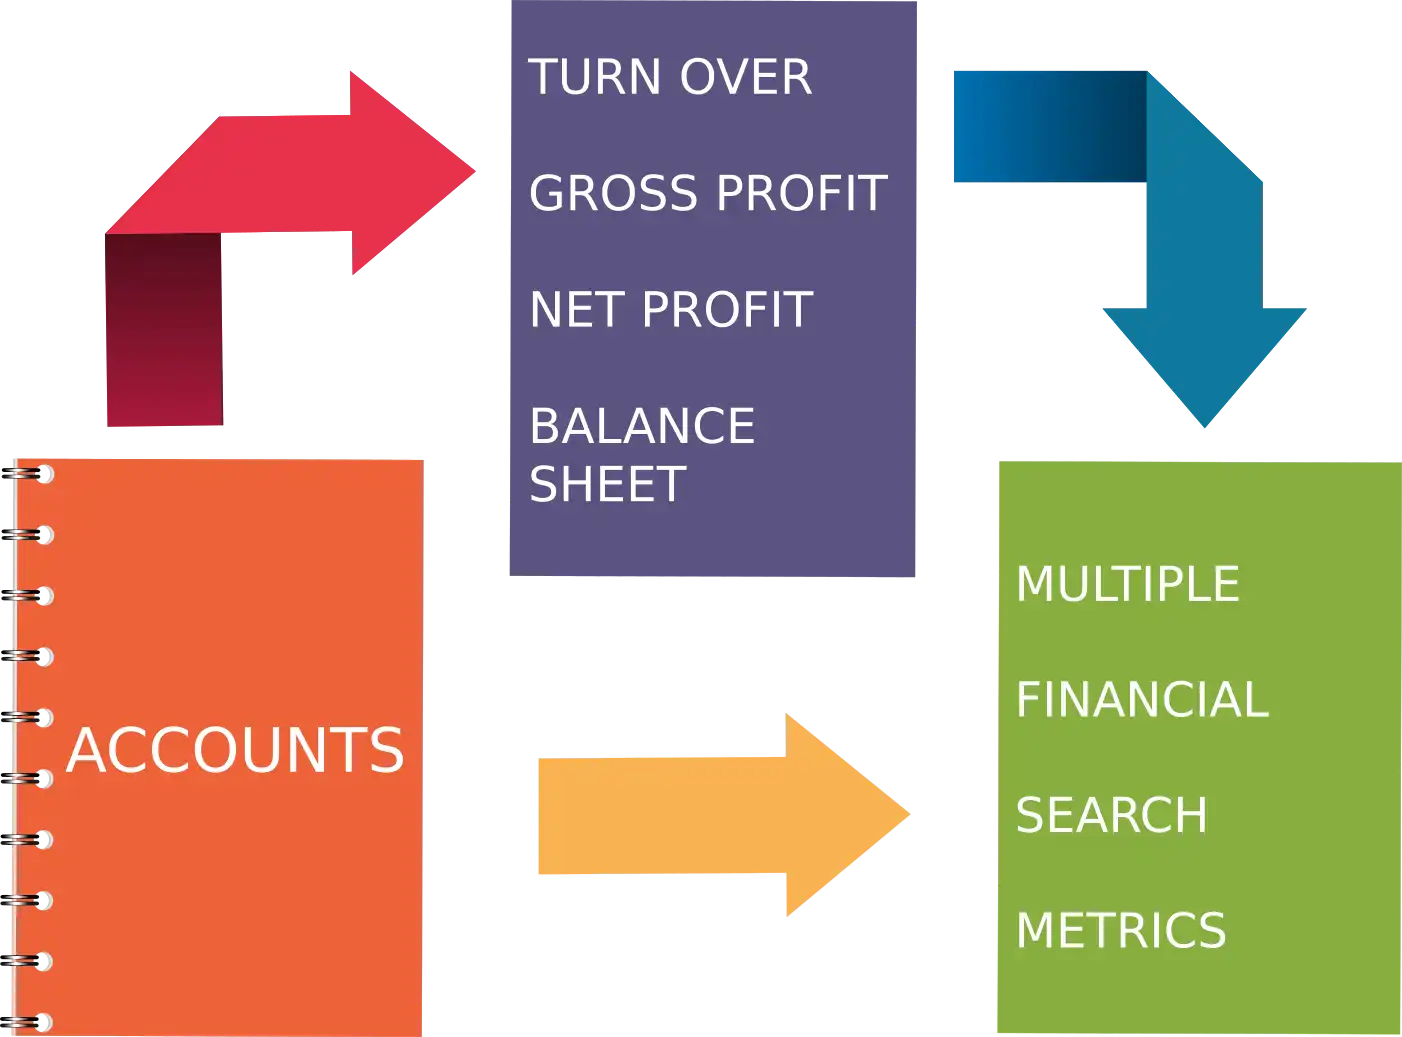
Having identified the list of firms with potential you can quickly produce comparative analysis reports or download the data to a spreadsheet. Averages and rankings in this niche search analysis will reflect the financial results of your chosen group. This means it is simple to compare the trends and potential of this niche group with those of the wider sector. USP Data is preloaded with some 1000+ researched sector reports or 730 SIC based reports.
Further the niche report listings will show their potential as a starting point of a buy & build strategy within a sector since using the firmographic data selections it is easy to find a count of more firms in a sector like the initial targets.
Contacting Opportunities
With USP Data you have unlimited access to the data you require so for a group of interest the contact details for main shareholders and or directors can be exported from the USP Data app in a format enabling customisation of the salutation. Many have found the main shareholder home address listing to be a particularly responsive contact point to begin an approach inquiring about succession plans.

5.3M
Companies

8.1M
Directors

7.3M
Shareholders and Shareholding Profile
Five Years
Financials

Export Responsive Address Data

Key Financial Search Metrics
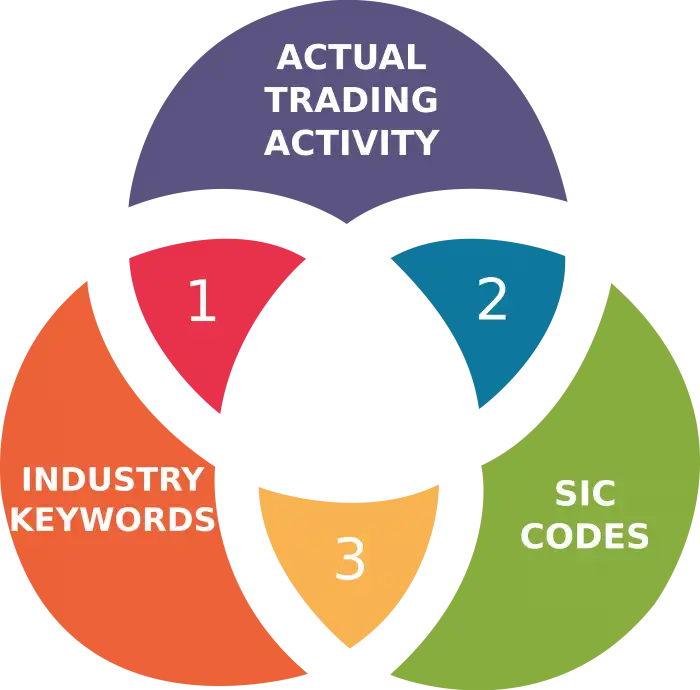
More focused data - 3 levels of search for better business segmentation
"Marvellous product. Congratulations. Very pleased to know of this resource, which I will definitely use again."
- Kenneth M... Head of Forensic Accountancy
Easy Business Segmentation into Niche industry reports - created in minutes
Leverage the research in 1000+ researched & 730+ SIC based industry analysis reports to customise your own niche group analysis

Data types
Reporting
- Year End
- Consolidated Indicator
- Number of Months
- Number of Employees
Profit & Loss
- Turnover
- Cost Of Goods Sold
- Gross Profit
- Administrative Expenses
- Operating Profit
- Exceptional Items
- Non-trading Income
- Profit Before Interest & Tax
- Interest Paid
- Pre-tax Profit
- Tax Paid
- Profit After Tax
- Dividends
- Retained Profit
Credit Indicators
- Credit Score
- Last Change in Credit Score
- Credit Limit
- Last Change in Credit Limit
Directors & Co. Secretary
- Title
- First Name
- Surname
- Age
Balance Sheet
- Land & Buildings
- Fixtures & Fittings
- Plant & Vehicles
- Total Tangible Assets
- Intangible Assets
- Total Fixed Assets
- Stock
- Debtors
- Cash & Liquid Assets
- Total Current Assets
- Trade Creditors
- Bank Loans & Overdrafts
- Total Current Liabilities
- Working Capital
- Net Assets
- Long Term Loans
- Issued Capital
- Retained Earnings
- Revaluation Reserves
- Shareholder Funds
- Capital Employed
Ownership & Subsidiaries
- Ultimate Parent Co.
- Parent Co.
- Subsidiaries
- Shareholders & Shareholding
KPIs & Ratios
- Gross Profit Margin
- Operating Profit Margin
- PBIT Margin
- Return On Total Assets
- Return On Capital Employed
- Return On Equity
- Current Ratio
- Quick Ratio
- Debt Ratio
- Times Interest Earned
- Credit Given
- Credit Taken
- Fixed Asset Turnover
- Stock Turnover
- Debtor Turnover
- Sales Per Employee
- Average Wage
- Growth In Sales
- Growth In Employees
Other USP Features
- 5.3M+ Live UK Company Profiles
- Financials – updated weekly
- Ownership links
- Directorship links
- Shareholding Profile
- Website
- Email information available
- 1000+ researched industry sector reports
- 730 SIC sector reports
- Customised niche report creation
- Automatic weekly updates to all live UK companies
- Lookup company to identify sector & competitors
- Print to PDF any UK company or group of companies
- View latest company documents at Companies House
- Import your research and find more companies like those you have found so far
- Export data templates to suit your processes
- Use the CRM to organise your wor on multiple concurrent projects
- Sector Search
- Financial Details Search
- Geographic Location Search
- Shareholder Profile Search
- Keyword Search
- Alphakey Search
- Postcode Search
- Director Search
- Parent Subsidiary Search
